Southern California Industrial Real Estate Broker
Ron Mgrublian
Principal
Los Angeles – Long Beach
Industrial Real Estate Advisor
CalDRE#: 01902882
We serve industrial property owners and tenants across the greater Los Angeles area to the Inland Empire markets, including Long Beach, Carson, Gardena, Paramount, Santa Fe Springs, Pomona, City of Industry, and Ontario.
What Our Clients Say

“Ron Mgrublian did an amazing job marketing our property... He was able to find us a suitable buyer and negotiated a good agreement for both parties. We intend to use Ron for all our future Commercial Real Estate needs. We highly recommend him.”
- Hani Nassif, Win Properties (Represented Seller)
"Ron Mgrublian was the perfect agent in so many ways, he had a positive effect on financial results, great engagement with inquires, and he managed to work well with a dual agent representation for seller and buyer. Went the extra mile for me and made us all satisfied with the outcome."
- Bobbi Allen, Allen Properties (Represented Seller & Buyer)
"I have worked with Ron for over 6 years on a few real estate deals from selling my commercial property to renting warehouses, he has always been available to me and a pleasure to work with! I highly recommend Ron!
- Chris McAlister, CBM Trading (Represented as Seller and Tenant)
"I had never met Ron in person when I hired him to list my commercial building in the city of Paramount for lease. This, to me, was beyond unusual, but I had little choice since I was out of state and needed to get it listed as soon as possible. I was very concerned as I had to rely on word-of-mouth from some associates and hoped against hope that it would turn out okay. My concerns were quickly eliminated.
Ron quickly created a professional listing, put signage on the site, and began full marketing of the property. Within days we had a tremendous amount of interest and Ron diligently conducted tours.
Because my criterion for an occupant was rather stringent, many possible tenants were turned away. The city also had their requirements which eliminated other possibilities. Ron never wavered and continued on course until we found a tenant that fit the bill on all counts.
None of this could have happened without Ron's easy-going demeanor, excellent communication skills, and committed persistence. His navigation of lease negotiation and problem solving is second to none.
Throughout, he has been kind and courteous and beyond flexible-- taking care of issues that arose even when they were outside the normal line of duty for a Real Estate professional.
In short, I could not be happier and would recommend Ron to anyone and everyone that needs a Commercial Realtor.
He is clearly in a class of his own."
- Derek Douglas, Douglas Trust (Represented Landlord)
Our Brokerage Services
Ron's coverage spans Southern California's industrial corridors — from the greater Los Angeles to the Inland Empire markets including LA South Bay, LA Central, Mid-Counties, San Gabriel Valley, Orange County and the Inland Empire.
A Second Career Built on a First One
Before entering commercial real estate, Ron spent 20 years in the paper, print, and packaging industry — experience that gives him a practical, operator's understanding of the industrial tenants and owners he now represents. That background, paired with over a decade in brokerage, shapes how he approaches every assignment: with a strong work ethic, exceptional client service, and a commitment to getting deals done even under difficult circumstances.
Ron's top priority is earning trust through action. It's an approach that has led to many long-term client relationships that continue today, across a client roster that includes manufacturers, distributors, investors, and private owners throughout the region.
What Ron Does
Ron provides a full range of industrial real estate services, including:
- Sale and disposition of industrial and warehouse properties
- Acquisitions for owner-users and investors
- Industrial and warehouse leasing, representing both landlords and tenants
- Broker Opinion of Value and property valuation services
- 1031 exchange and investment property guidance
Track Record
Ron has completed a wide range of industrial transactions across Southern California, from large portfolio sales to single-tenant leases, including:
- $65,500,000 sale of a 288,195 SF industrial building in Pomona
- $7,350,000 sale of a 190,357 SF property in Pomona
- 100,345 SF lease in Rancho Cucamonga
- $4,950,000 sale of an industrial property at 125 W 157th St, Gardena
- Numerous additional sale and lease transactions throughout Long Beach, City of Industry, Pomona, Carson, Gardena, Irwindale, Paramount, and beyond
Education & Credentials
- MBA, Pepperdine University
- B.S. in Marketing, University of Arizona
- Member, American Industrial Real Estate Association (AIR)
- Founder, Beach Cities Business Group
- CalDRE #01902882
Beyond the Office
Ron lives in Seal Beach, California, with his wife, Tracy, and their three children. He is an active member of the local business community as the founder of the Beach Cities Business Group. Outside of work, Ron enjoys mountain biking and has been known to run the occasional triathlon.
Let's Talk About Your Property
Whether you're looking to sell, buy, lease, or simply find out what your industrial property is worth, Ron is ready to help.
Ron Mgrublian
Principal, Lee & Associates Los Angeles – Long Beach
Direct: 562-354-2537
rmgrublian@leelalb.com
5000 E Spring St, Suite 600, Long Beach, CA 90815
CalDRE# 01902882
Industrial Real Estate Insights
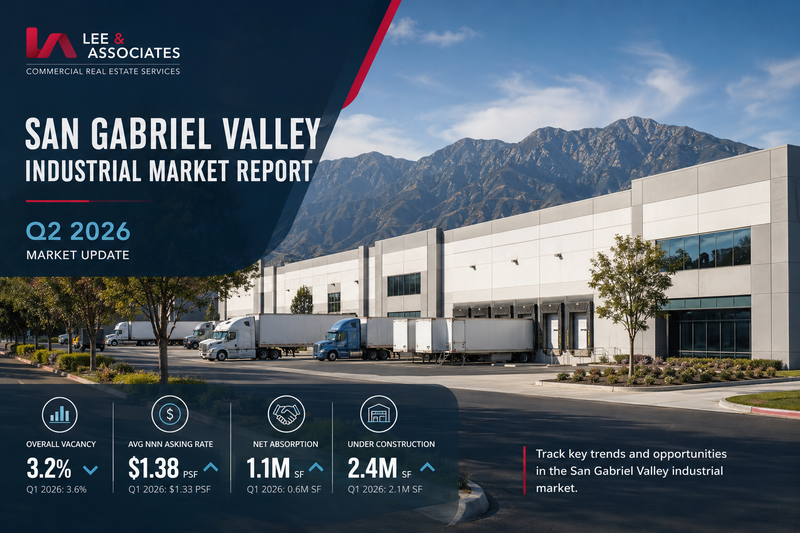
Industrial demand rebounded sharply in the San Gabriel Valley during Q2 2026, with vacancy tightening and cap rates compressing to their lowest level in over a year.
Read More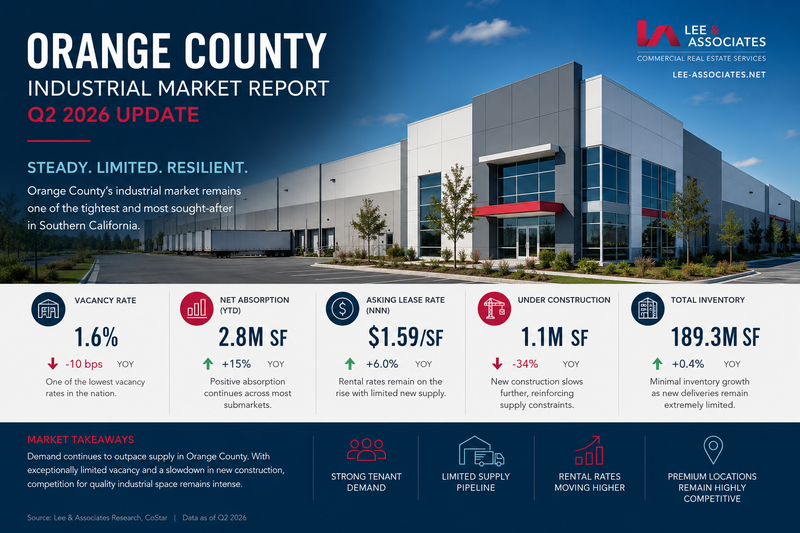
Orange County's industrial vacancy just hit a 15-year high while sale prices and cap rates moved in owners' favor in some ways and against them in others. Here's what the Q2 2026 numbers mean if you own industrial property in the market.
Read More
A roundup of RV storage, parking, and outdoor storage properties currently for sale across the LA to Inland Empire industrial corridor.
Read More
Carson's industrial vacancy has jumped to 7.8% on a wave of large move-outs, while asking rents pull back from 2023 highs. Here's what owners and tenants need to know.
Read MoreF.A.Q
Q: What areas does Ron Mgrublian serve?
Q: What types of industrial properties does Ron work with?
Q: Does Ron represent both property owners and tenants?
Q: How do I find out what my industrial property is worth?
Q: Is there a cost for a property valuation?
Q: Does Ron help with 1031 exchanges?
Q: Can Ron help find properties that aren't publicly listed?
Q: How do I get started?
Contact Us
- 5000 East Spring Street, Long Beach, CA, USA
- Suite 600